
A Three-Layer Benchmarking Framework for AI Knowledge Assistants - Part 2: Results

A quick recap of what we measured in Part 1: retrieval (did the system find the right source?), generation (was the answer accurate, complete, and well-formatted, scored across five dimensions in an LLM-as-a-judge scheme), and user experience (latency, formatting, and cost). Now the results.

Step 2 Results: Retrieval

Our baseline is standard off-the-shelf retrieval: documents split into fixed text chunks, matched to queries using vector similarity.

Our proprietary retrieval framework, JEKLTM hit 96% on finding the correct source material, versus 78% for the baseline. More importantly, it ranked the correct source first on 9 out of 10 questions at minimum retrieval settings, meaning the right answer was the top result before we even retrieved anything else.

The category breakdown tells the more interesting story:

Category JEKL Hit Rate Baseline Hit Rate JEKL Recall Baseline Recall
1 Code Lookup 100% 60% 1.000 0.600
2 Modifier Traps 100% 90% 1.000 0.900
3 Table-Trapped Data 100% 90% 1.000 0.850
4 Cross-Section 90% 90% 0.900 0.867
5 Acronym-Heavy 90% 60% 0.850 0.550
Overall 96% 78% 0.950 0.753

A few observations that stand out:

  • Code Lookup: This is the biggest gap. The baseline missed 4 out of 10 code-specific questions entirely. These are queries like "what HCPCS code is used for Therapeutic Mentoring?" where the answer is a single identifier buried in a table row. Vector similarity on raw text chunks struggles here because the query vocabulary and the document vocabulary don't overlap. JEKL found the correct source on all 10.
  • Acronym-Heavy: This is the second biggest gap. 90% vs 60% hit rate, with 4 of the 11 outright JEKL wins in this category. The baseline returned no useful result on questions about PASRR, COS 021/022/023, MEDI, and DON. These are domain-specific acronyms that general-purpose embedding models have no meaningful representation for. JEKL retrieved the correct context for all but one.
  • Cross-Section Questions: These were the most competitive. Both systems hit 90% here. These are questions that require synthesizing information across multiple sections, and both systems struggled equally with the hardest ones.

Precision appears low in absolute terms - this is by design. Broad retrieval maximizes recall on complex policy questions where answers span multiple sections. The PR curve tells the full story: JEKL's advantage holds across every retrieval setting, not just a single snapshot.
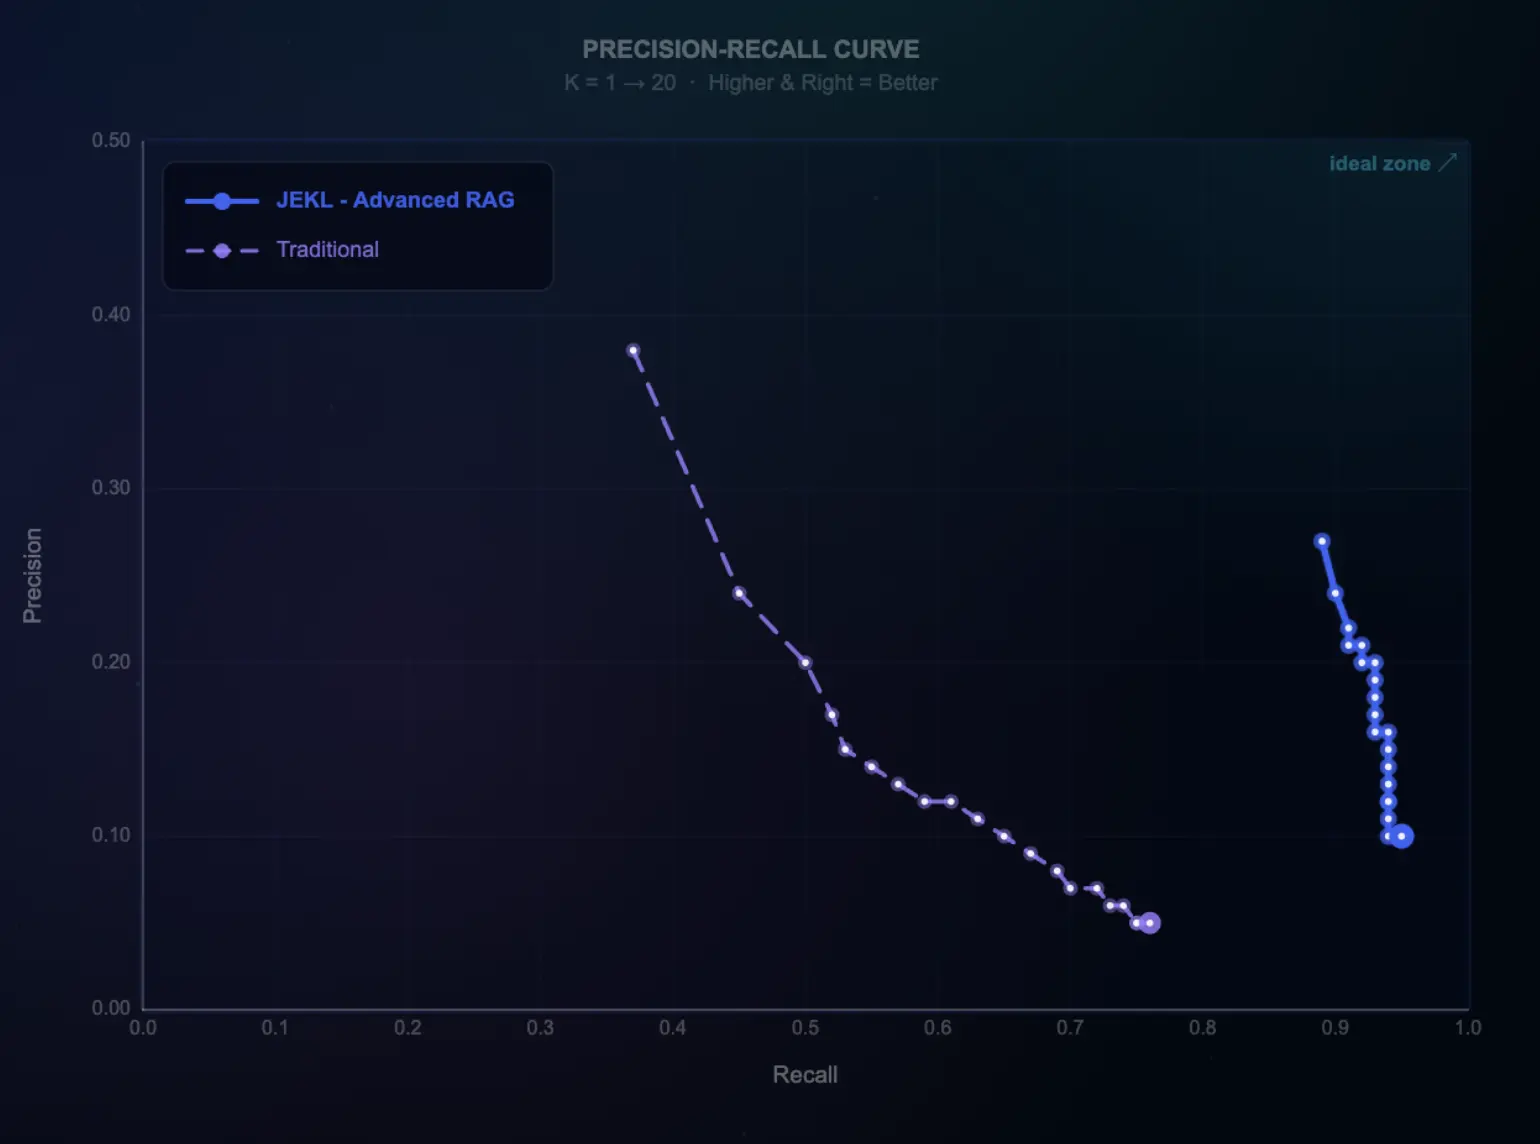
Figure 1: Precision-Recall Curve

Step 2 Results: Generation
Figure 2: Generation Quality Metrics
Category JEKL Accuracy Baseline Accuracy JEKL Composite Baseline Composite
1 Code Lookup 4.00 1.80 4.244 2.668
2 Modifier Traps 4.40 4.50 4.468 4.172
3 Table-Trapped Data 4.30 3.40 4.364 3.540
4 Cross-Section 4.20 4.50 4.208 4.104
5 Acronym-Heavy 3.40 2.70 3.960 2.964
Overall 4.06 3.38 4.249 3.490

Note: All generation metrics are scored on a 1–5 scale in an LLM-as-a-judge scheme, where 5 is the highest. Composite is the unweighted average across all five dimensions.

The generation results mirror the retrieval story, with one nuance worth noting.


Code Lookup shows the largest generation gap: JEKL accuracy 4.00 vs baseline 1.80. This is a direct consequence of retrieval. The baseline missed the correct source on 4 of 10 code questions, and when you retrieve the wrong page, you generate the wrong code. In one instance, the baseline retrieved the correct page but still generated a different code from an adjacent table row. Retrieval quality sets the ceiling for generation quality.


Acronym-Heavy was our weakest category on generation (composite 3.96) despite strong retrieval. The reason: acronym-dense responses tend to elaborate beyond the source material, which the judge penalized on hallucination safety. While the retrieval was right, the responses were occasionally too verbose.


Modifier Traps and Cross-Section were the most competitive on generation. The baseline's concise citation-style answers scored marginally higher on accuracy in these categories. However, JEKL's composite score was still higher across both, driven by completeness and formatting quality


The radar chart tells the story visually - two very different shapes, two different approaches to answering. Our system optimizes for completeness and accuracy. The baseline optimizes for brevity.
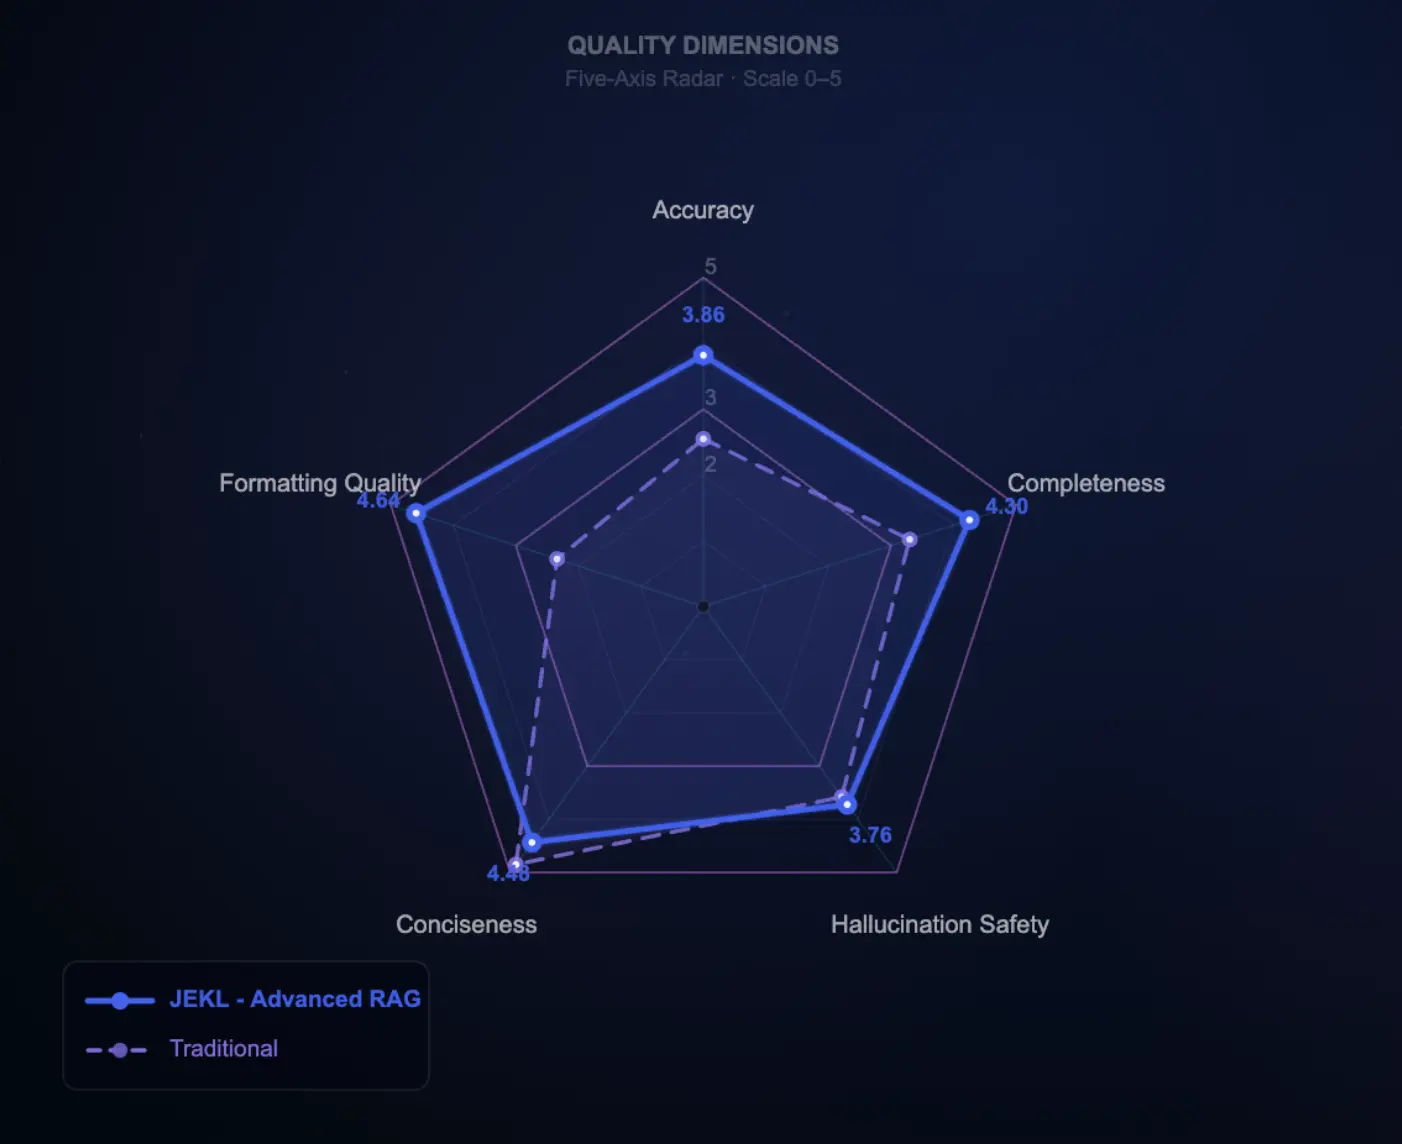
Figure 3: Quality Dimensions Radar Chart

Step 3 Results: User Experience

Latency
Average end-to-end generation time for our system was 11.5 seconds per query.


Formatting Quality
Our system scored 4.64 out of 5 on formatting quality versus 2.34 for the baseline. The difference is visible in the responses: our system returns structured tables, bullet points, and section headers appropriate to the complexity of the question. The baseline returns terse citation-style answers that score well on conciseness but poorly on usability for complex multi-part questions.


Cost
Good retrieval pays compounding dividends here. Precise retrieval means shorter, more focused context per query. This means smaller models can perform at the level of much larger ones on domain-specific tasks. We run generation on a 4-bit AWQ quantized version of Gemma 4 26B on a single NVIDIA L40S GPU instance (48GB). This delivers production-grade output, fully self-hosted, no frontier model API dependency. Better retrieval directly expands your deployment options and reduces cost at scale.


Wrapping up

AI in regulated industries isn't just about capability, it's about verifiability. It’s easy to demo a system on easy questions. The benchmark is how you find out what breaks.

If you're building a RAG-based knowledge assistant for regulated industries and want to compare notes on benchmarking methodology, reach out.

Background

A quick recap of what we measured in Part 1: retrieval (did the system find the right source?), generation (was the answer accurate, complete, and well-formatted, scored across five dimensions in an LLM-as-a-judge scheme), and user experience (latency, formatting, and cost). Now the results.

Step 2 Results: Retrieval

Our baseline is standard off-the-shelf retrieval: documents split into fixed text chunks, matched to queries using vector similarity.

Our proprietary retrieval framework, JEKLTM hit 96% on finding the correct source material, versus 78% for the baseline. More importantly, it ranked the correct source first on 9 out of 10 questions at minimum retrieval settings, meaning the right answer was the top result before we even retrieved anything else.

The category breakdown tells the more interesting story:

Category JEKL Hit Rate Baseline Hit Rate JEKL Recall Baseline Recall
1 Code Lookup 100% 60% 1.000 0.600
2 Modifier Traps 100% 90% 1.000 0.900
3 Table-Trapped Data 100% 90% 1.000 0.850
4 Cross-Section 90% 90% 0.900 0.867
5 Acronym-Heavy 90% 60% 0.850 0.550
Overall 96% 78% 0.950 0.753

A few observations that stand out:

  • Code Lookup: This is the biggest gap. The baseline missed 4 out of 10 code-specific questions entirely. These are queries like "what HCPCS code is used for Therapeutic Mentoring?" where the answer is a single identifier buried in a table row. Vector similarity on raw text chunks struggles here because the query vocabulary and the document vocabulary don't overlap. JEKL found the correct source on all 10.
  • Acronym-Heavy: This is the second biggest gap. 90% vs 60% hit rate, with 4 of the 11 outright JEKL wins in this category. The baseline returned no useful result on questions about PASRR, COS 021/022/023, MEDI, and DON. These are domain-specific acronyms that general-purpose embedding models have no meaningful representation for. JEKL retrieved the correct context for all but one.
  • Cross-Section Questions: These were the most competitive. Both systems hit 90% here. These are questions that require synthesizing information across multiple sections, and both systems struggled equally with the hardest ones.

Precision appears low in absolute terms - this is by design. Broad retrieval maximizes recall on complex policy questions where answers span multiple sections. The PR curve tells the full story: JEKL's advantage holds across every retrieval setting, not just a single snapshot.

Figure 1: Precision-Recall Curve

Step 2 Results: Generation
Figure 2: Generation Quality Metrics
Category JEKL Accuracy Baseline Accuracy JEKL Composite Baseline Composite
1 Code Lookup 4.00 1.80 4.244 2.668
2 Modifier Traps 4.40 4.50 4.468 4.172
3 Table-Trapped Data 4.30 3.40 4.364 3.540
4 Cross-Section 4.20 4.50 4.208 4.104
5 Acronym-Heavy 3.40 2.70 3.960 2.964
Overall 4.06 3.38 4.249 3.490

Note: All generation metrics are scored on a 1–5 scale in an LLM-as-a-judge scheme, where 5 is the highest. Composite is the unweighted average across all five dimensions.

The generation results mirror the retrieval story, with one nuance worth noting.


Code Lookup shows the largest generation gap: JEKL accuracy 4.00 vs baseline 1.80. This is a direct consequence of retrieval. The baseline missed the correct source on 4 of 10 code questions, and when you retrieve the wrong page, you generate the wrong code. In one instance, the baseline retrieved the correct page but still generated a different code from an adjacent table row. Retrieval quality sets the ceiling for generation quality.


Acronym-Heavy was our weakest category on generation (composite 3.96) despite strong retrieval. The reason: acronym-dense responses tend to elaborate beyond the source material, which the judge penalized on hallucination safety. While the retrieval was right, the responses were occasionally too verbose.


Modifier Traps and Cross-Section were the most competitive on generation. The baseline's concise citation-style answers scored marginally higher on accuracy in these categories. However, JEKL's composite score was still higher across both, driven by completeness and formatting quality


The radar chart tells the story visually - two very different shapes, two different approaches to answering. Our system optimizes for completeness and accuracy. The baseline optimizes for brevity.

Figure 3: Quality Dimensions Radar Chart

Step 3 Results: User Experience

Latency
Average end-to-end generation time for our system was 11.5 seconds per query.


Formatting Quality
Our system scored 4.64 out of 5 on formatting quality versus 2.34 for the baseline. The difference is visible in the responses: our system returns structured tables, bullet points, and section headers appropriate to the complexity of the question. The baseline returns terse citation-style answers that score well on conciseness but poorly on usability for complex multi-part questions.


Cost
Good retrieval pays compounding dividends here. Precise retrieval means shorter, more focused context per query. This means smaller models can perform at the level of much larger ones on domain-specific tasks. We run generation on a 4-bit AWQ quantized version of Gemma 4 26B on a single NVIDIA L40S GPU instance (48GB). This delivers production-grade output, fully self-hosted, no frontier model API dependency. Better retrieval directly expands your deployment options and reduces cost at scale.


Wrapping up

AI in regulated industries isn't just about capability, it's about verifiability. It’s easy to demo a system on easy questions. The benchmark is how you find out what breaks.

If you're building a RAG-based knowledge assistant for regulated industries and want to compare notes on benchmarking methodology, reach out.

Background

What’s a Rich Text element?

The rich text element allows you to create and format headings, paragraphs, blockquotes, images, and video all in one place instead of having to add and format them individually. Just double-click and easily create content.

Static and dynamic content editing

A rich text element can be used with static or dynamic content. For static content, just drop it into any page and begin editing. For dynamic content, add a rich text field to any collection and then connect a rich text element to that field in the settings panel. Voila!

How to customize formatting for each rich text

Headings, paragraphs, blockquotes, figures, images, and figure captions can all be styled after a class is added to the rich text element using the "When inside of" nested selector system.

Situation

Situation

Solution

Results

Types of Journeys

Tech Stack